
 printer friendly version
1.1 HOW-TO Inspect
This HOW-TO deals primarily with image inspection methods. Other inspection routines are described in their relevent sections (see, e.g., http://www.astro-wise.org/portal/howtos/man_howto_qcastrom/man_howto_qcastrom.shtmlastrometry inspection and http://www.astro-wise.org/portal/howtos/man_howto_zeropoint/man_howto_zeropoint.shtmlphotometry inspection) These and other inspection routines may eventually be linked from this HOW-TO formally, but they will never be described in any detail here.
1.1.1 Image Inspect Plot
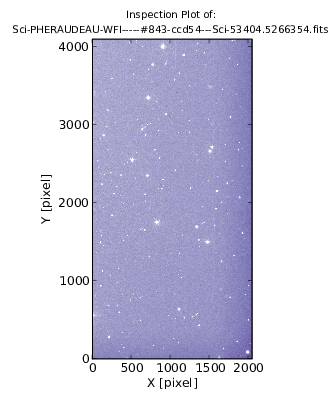
Image inspection takes place primarily a MatPlotLib (PyLab) window and is
illustrated in figure ![[*]](crossref.png) . The plot contains a representation
of the image with a title containing the filename of the frame being inspected.
There are also pixel coordinate indicators for convenience. As this plot is
within a Pylab window, all the familiar manupulation routines are available
(e.g., panning, zooming, etc.) In addition to these, there are some single-key
commands to create new plots that illustrate specific details around the cursor
position. The next section gives details on these.
. The plot contains a representation
of the image with a title containing the filename of the frame being inspected.
There are also pixel coordinate indicators for convenience. As this plot is
within a Pylab window, all the familiar manupulation routines are available
(e.g., panning, zooming, etc.) In addition to these, there are some single-key
commands to create new plots that illustrate specific details around the cursor
position. The next section gives details on these.
1.1.2 Image Inspect Method
Image inspection can be called from any BaseFrame-derived frame, and is called by executing the frame's inspect() method:
awe> frame = BaseFrame(pathname='filename.fits')
awe> frame.inspect()
There are also a large number of options to control how the plot looks and even what is plotted. A summary of the options is given below:
- pixels:
- optional list or array representing the image to be inspected (can be MxN for greyscale, or MxNx3 for RGB)
- zone:
- tuple of (x0, y0, x1, y1) representing the image coordinates of the two oposing corners of the sub image to consider
- kappa:
- the factor by which the dynamic range is increased in units of sigma (0 gives full range)
- iterations:
- number of iterations in the kappa-sigma range clipping
- cmap:
- PyLab color map instance
- vmin:
- lower display range in native units (e.g. ADU)
- vmax:
- upper display range in native units (e.g. ADU)
- interpolation:
- type of interpolation the PyLab viewer uses (nearest, bilinear, etc.)
- width:
- width of the PyLab figure window (in inches)
- ratio:
- ratio by which to scale the figure height (default: x_dim/y_dim)
- viewer:
- external viewer to use in case the image is too large
- force_viewer:
- always use the viewer
- subplot_size:
- width and height in pixels of region of interest
- contour_levels:
- number of contour levels for the contour plot of the region of interest
- num_bins:
- number of bins in the histogram plot
- extension:
- extension of the filetype to save plot to (png, ps, or eps) None disables saving
- compare:
- compare this frame to its previous version using difference imaging (current-previous), pixels is ignored
- level:
- depth of query for previous version (0 goes as deep as possible) when compare is True
- other:
- a second of the same type of Frame object to replace previous when compare is True (if color is True, other can be a list of two images)
- clip:
- kappa-sigma clip each image prior to subtraction when compare is True
- color:
- use color combining (RGB) instead of differencing when compare is True (kappa, vmin/vmax only honored when clip is True), this image is R, other is B if single, other is [G, B] if it is a list (EXPERIMENTAL)
Also, there are a number of commands that work on an area around the current cursor position. A summary of these commands are given below:
- q
- closes the most recent plot window when pressed in the main window
- SPACE
- displays the X and Y coordinate (FITS standard unit indexed) and the count level
- a
- performs aperture photometry on brightest feature in the region of interest (NOT YET IMPLEMENTED)
- c
- displays a contour plot of the region of interest (see contour_levels)
- h
- displays a histogram of the pixel values of the region of interest (see num_bins)
- r
- displays a radial plot of the brightest feature in the region of interest
- w
- displays a wireframe plot of the region of interest
- p
- displays profile plots in both X and Y dimensions versus intensity (count level)
Please see the inspect docstring for more details and current details on both of these:
awe> help(frame.inspect)
1.1.3 Image Display Method
A display method is available for all frames:
awe> frame.display()
This will open up the frame in skycat, by default.